What a scale won't tell you.
Body fat percentage for adults aged 20–59, from four tape measurements and a formula re-trained on DXA-scanned NHANES subjects. Pick a sex and the readout tunes to that channel — results update as you type.
Trained on US adults aged 20–59. Less reliable under 20, over 60, or for elite athletes. Not medical advice.
Fill these in to see your estimate
- Sex
- Age
- Height
- Weight
- Waist
- Hip
- Arm circumference
Two formulas, honestly benchmarked.
Most published tape-measure formulas were fit on 100–250 people, one sex, against hydrostatic weighing or skinfolds, often with no out-of-sample check. These two were fit on 2,202 NHANES adults against DXA — a direct fat/lean/bone scan — with terms chosen by L1-regularized regression under cross-validated stopping, then re-fit by ordinary least squares for clean coefficients. Three results held up across both NHANES and an independent hydrostatic dataset:
Waist alone beats the sum of circumferences.
Summing waist + hip + arm is worse than waist by itself (3.79 vs 3.48 RMSE, men). Extra measurements only help when the model can weight them separately — sometimes with opposite signs.
Linear beats gradient boosting.
With the right transforms (logs, ratios), a linear fit matches tuned gradient boosting to within hundredths of a point. No hidden nonlinear structure to uncover, so the interpretable form wins.
Age is redundant with circumferences.
Adding age moves CV RMSE by 0.02 pp — below the noise of the cross-validation itself. By the time the tape is on you, the age signal is already in the numbers.
The formulas in full. All lengths in cm; BMI = weight kg / (height m)².
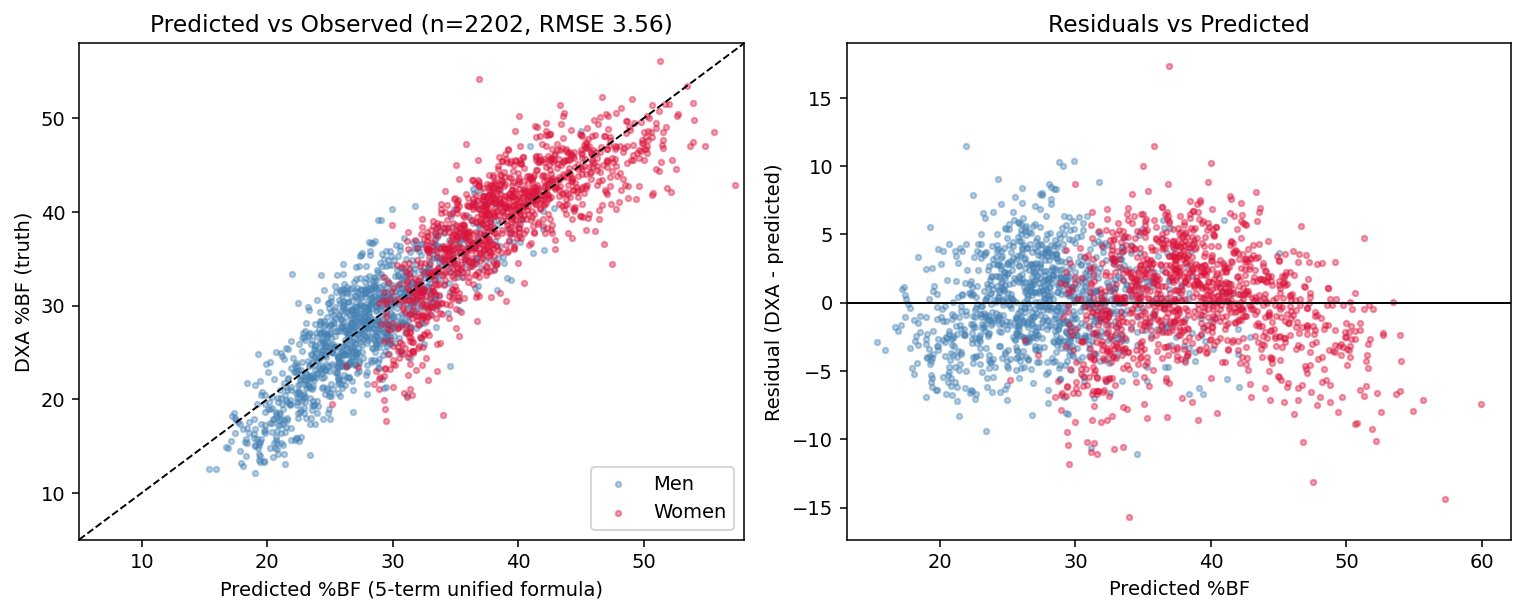
That ±5.17 %BF band is a split-conformal 90% prediction interval (empirical coverage 90.9%), not a standard error — it reflects the irreducible person-to-person spread, which is what you actually want to know before trusting a single number.
Recalibrating BMI against body fat.
The classical cutoffs (18.5 / 25 / 30) are sex-blind, age-blind, and set when Americans were leaner. Taking the Gallagher (2000) body-fat category boundaries as the target and asking which BMI cutoffs best assign today's US adults to them — pooling NHANES cycles H+J, n=5,260 — gives tighter, group-specific thresholds. The "overweight" cutoff drops 3–4 points; for young men it lands at 21.9, four below the textbook 25.
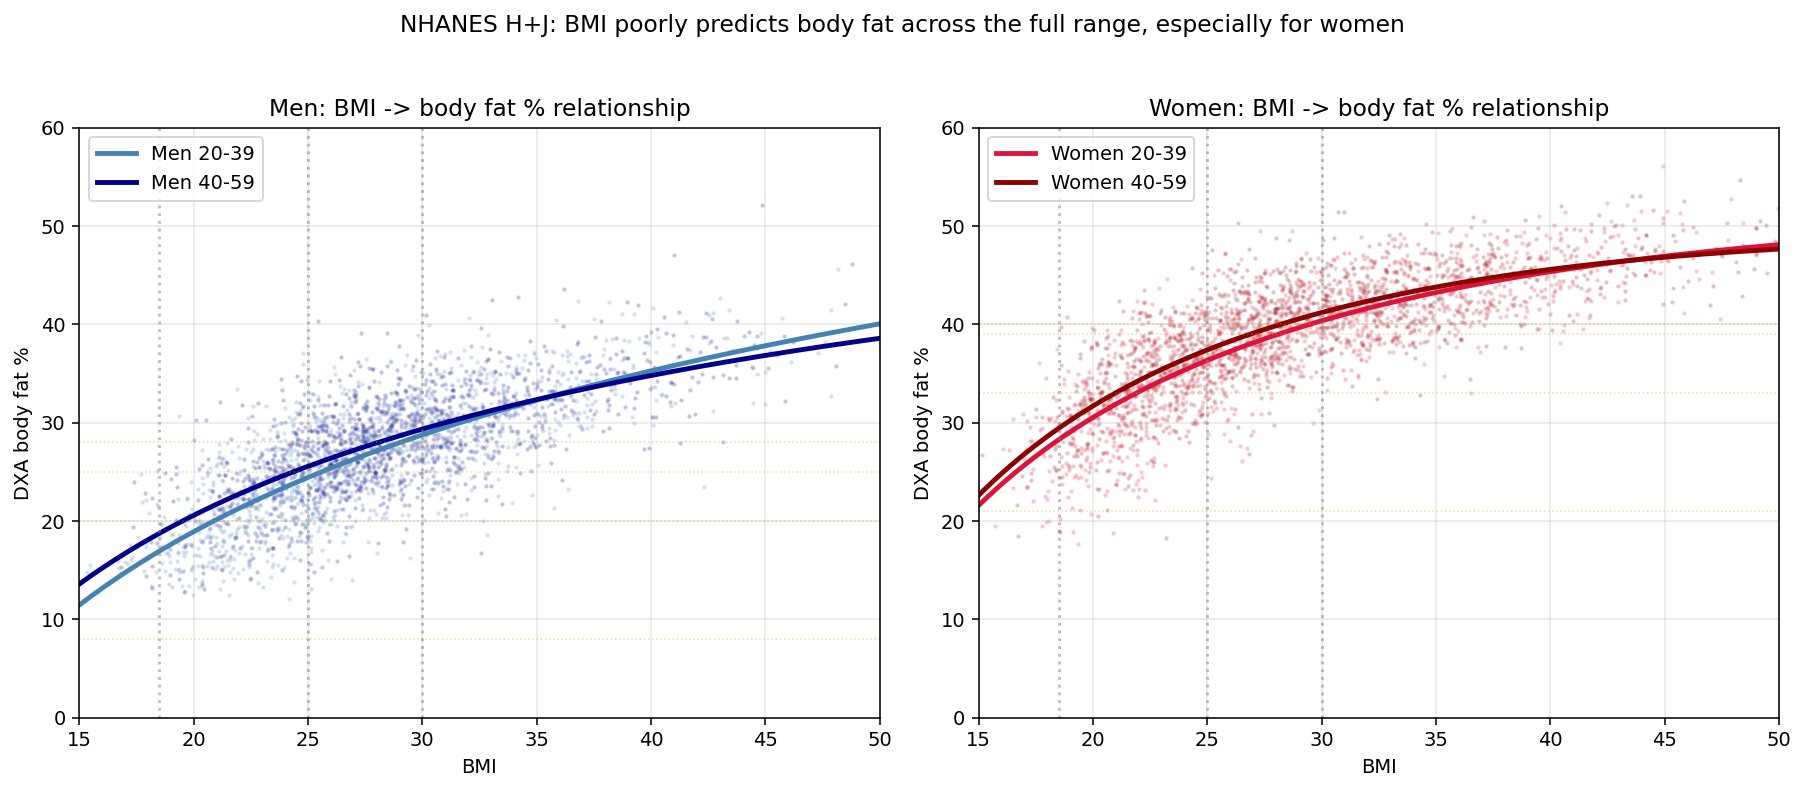
| Group | n | Underweight | Healthy ≤ | Overweight ≥ |
|---|---|---|---|---|
| Men 20–39 | 1,287 | — | 21.9 | 25.4 |
| Men 40–59 | 1,286 | — | 21.3 | 28.6 |
| Women 20–39 | 1,289 | <15.8 | 22.0 | 28.2 |
| Women 40–59 | 1,398 | <16.8 | 21.7 | 27.9 |
| Classical (sex-blind) | — | <18.5 | 25.0 | 30.0 |
Underweight is omitted for men (population frequency ~0.3%, too low to calibrate). The shift isn't subtle: a young man at BMI 26 — currently "overweight" — sits in the obese range under the body-fat definition.
One table for everybody
Sex- and age-specific
How to measure yourself.
How well you measure matters more than which formula you use: a 1 cm waist error costs ~0.4 pp of body fat. Use a soft cloth or tape, held horizontal and snug but not compressing, read at the end of a normal exhale, over bare skin or thin clothing.
The five measurements, in detail
No shoes, heels and back to a wall, looking straight ahead.
You lose 1–2 cm by afternoon as discs compress — measure in the morning.
Morning, after the bathroom, before food. Same scale every time — consistency beats absolute accuracy.
Day-to-day swings of ±1–2 kg are water; average a week if tracking a trend.
At the navel / narrowest point, tape horizontal. Stand relaxed, don't suck in, read on a gentle exhale.
The single most informative measurement. If you take only one, take this.
Around the widest part of the buttocks, feet together, weight even. Thin clothing or none.
Usually 7–10 cm below the iliac crest at the top of the pelvis.
Midpoint between shoulder tip and elbow, arm hanging relaxed — not flexed.
Use the non-dominant arm; it's slightly less hypertrophied.
What this can't do.
- It's a population-average tool, not an individual diagnostic. At any fixed set of inputs, real body fat varies 6–10 pp between people. A muscular athlete and a sedentary person at the same waist and BMI get the same prediction; their truth can differ by 10 points. If you suspect you're in either tail, get a DXA scan.
- Trained on US adults 20–59, not pregnant. Under-20s, over-60s, pregnant or lactating women, and elite athletes are under-represented. Older adults especially gain visceral fat and lose lean mass at the same anthropometry, so the formulas under-classify them.
- The Gallagher bands are a convention. There's no biological cliff at 20% (men) or 33% (women). The categories were built to mirror the BMI bands in body-fat space, and inherit that arbitrariness.
- The errors aren't symmetric. DXA slightly under-reads fat in very lean people and over-reads it in very obese ones; self-measured waists tend ~1 cm tight. Read the interval, not just the point.
- Not medical advice. If your estimate suggests intervention, a clinician has other indicators — lipids, glucose, fitness — that change the picture.